GO, DOCKER, & PROMETHEUS ⚡ Powered

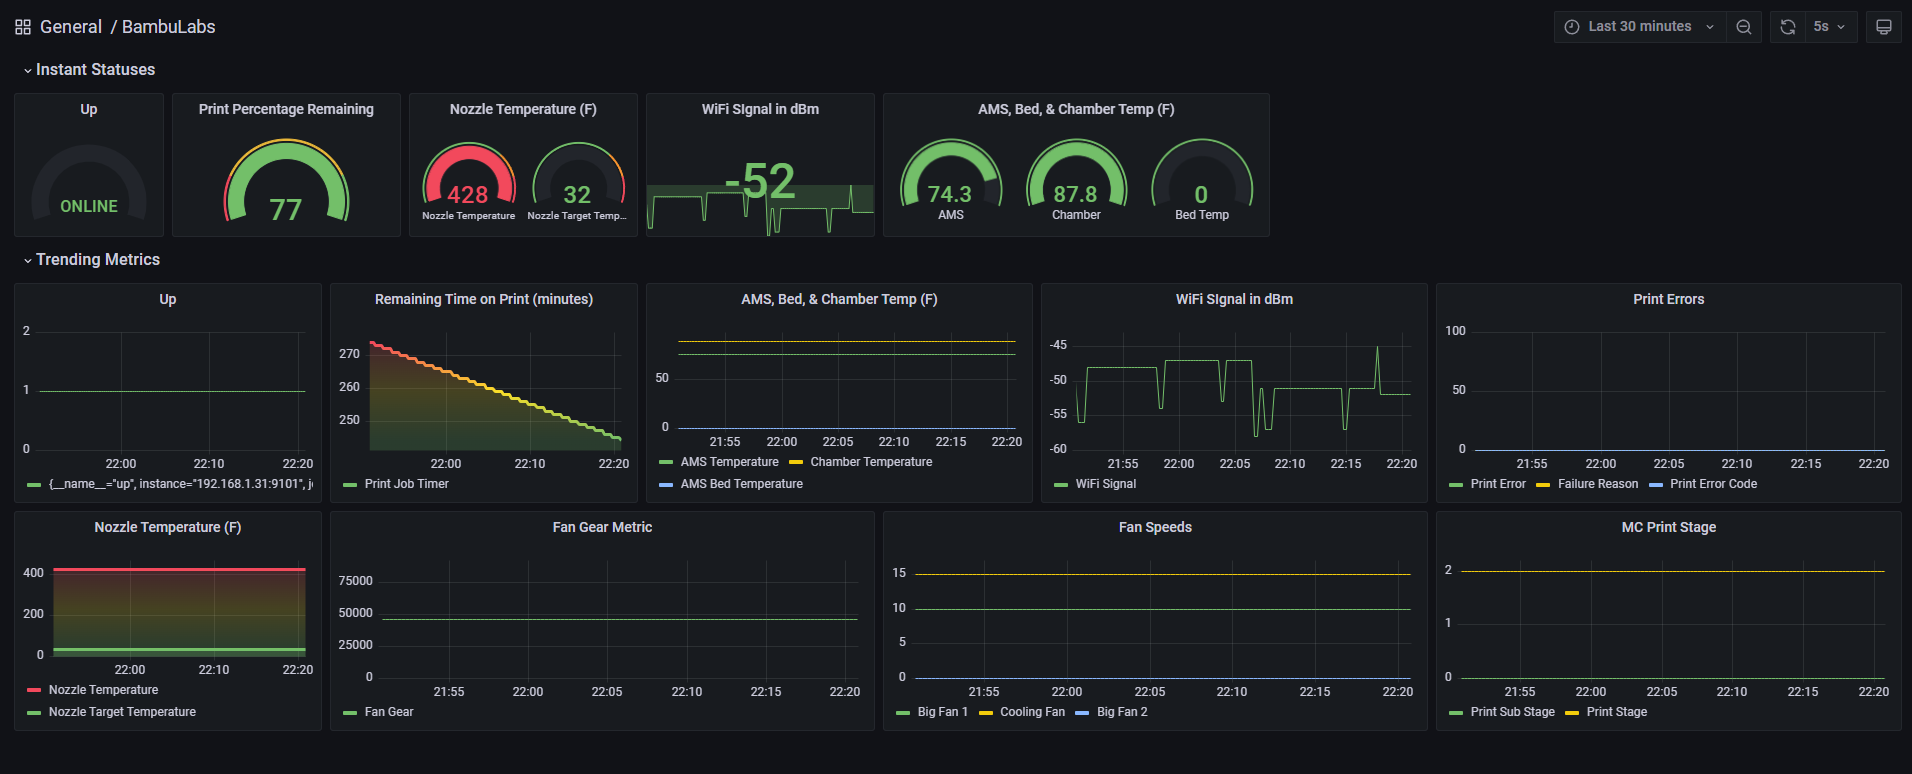
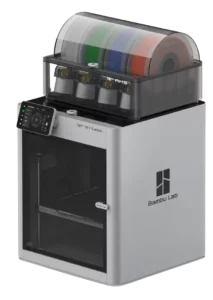
The BambuLabs X1Carbon printer is pretty fantastic. As I’ve ran down the rabbit hole of the Prometheus/Grafana stack I decided to see if I could build an exporter for my recently purchased printer the X1C. *Please note this is still an in progress project and I actively check the github comments.
https://github.com/Aetrius/Bambulabs-Exporter <- Project is here
This is an MQTT Exporter powered by Go & Docker.
https://hub.docker.com/r/aetrius/bambulabs-exporter <- Docker image here
Grab Printer Information for Exporters
Printer IP & Password
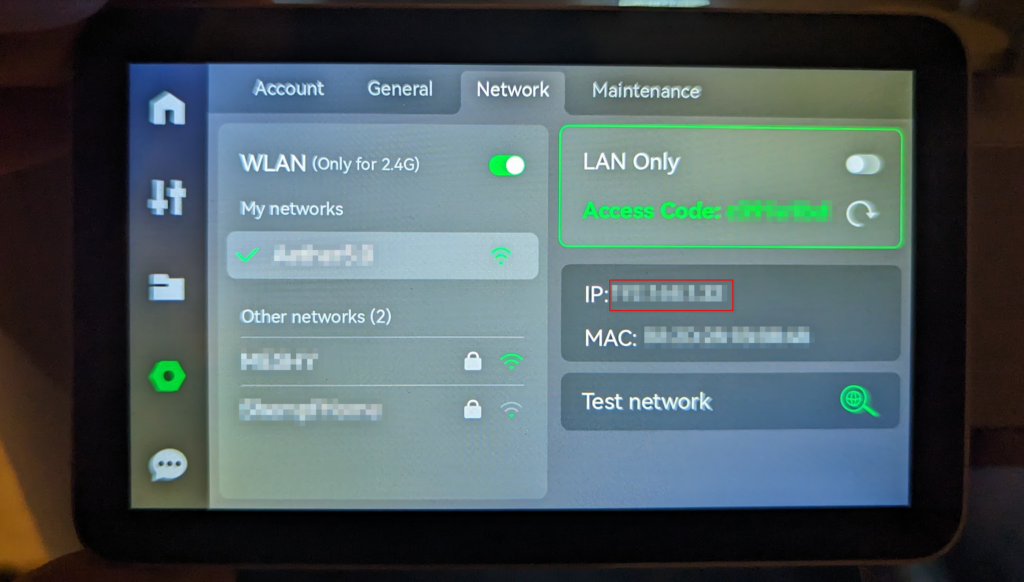
This information is in your printer interface.
You physically will collect this from your printer. If you navigate to the hex > Network you can see the Access code which is your password and the IP of the printer both listed.

MQTT Stream Information aka device/<SERIAL_NUMBER>/report
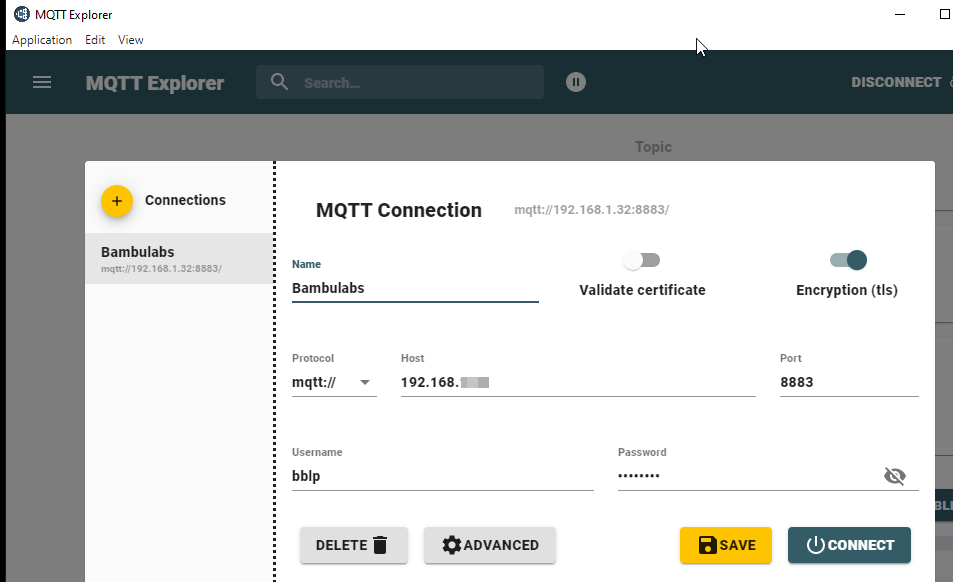
I suggest downloading an open source software called MQTT Explorer. Mirror your settings to what I have in the screenshot below.
Place your access code / password into the password field.

For your MQTT stream if you drill down to the report section you can see the Topic on the right hand side. I suggest pressing the clipboard button and it should copy something like “device/0000asdfasdfasdmf/report”. You will use this with the exporter variables later on.

Run Prometheus Exporter Locally
Ensure you have Docker and Docker-Compose installed locally.
Copy the following code into a file called bambu-compose.yml
---
version: "2.0"
services:
  bambulabs-aetrius-exporter:
    image: aetrius/bambulabs-exporter
    env_file: .env
    container_name: bambulabs-aetrius-exporter
    ports:
      - "9101:9101"
    networks:
      - monitoring

    environment:
          - BAMBU_PRINTER_IP="YOUR_PRINTER_IP"
          - USERNAME="bblp"
          - PASSWORD="YOUR_PRINTER_PASSWORD"
          - MQTT_TOPIC="device/<SERIAL_NUMBER>/report"
networks:
  monitoring:
    driver: bridge
Run the following command to spin up the docker container
docker-compose -f bambu-compose.yml up -dRun Prometheus/Grafana Stack Locally
Run through the following directions to setup the Prometheus / Grafana Stack locally that includes the dashboards pre-compiled.
https://github.com/Aetrius/Bambulabs-Exporter/blob/main/README-FULLSTACK.md
Run Prometheus Exporter in Kubernetes
This assumes you have a Kubernetes cluster or a K3s host(s) that you can run these manifest files on. In addition this assumes you have Prometheus running in your cluster to scrape the target hosts.
I use the OpenLens tool to connect to my cluster manually.
In a repo of your choice create the following files:
bambulabs-namespace.yml
---
apiVersion: v1
 kind: Namespace
 metadata:
   name: exporters
bambulabs-deployment.yml
---
apiVersion: apps/v1
kind: Deployment
metadata:
  name: bambuexporter-server
  namespace: exporters
spec:
  selector:
    matchLabels:
      app: bambuexporter
  template:
    metadata:
      labels:
        app: bambuexporter
    spec:
      containers:
      - name: bambulabs
        image: aetrius/bambulabs-exporter:latest
        env:
          - name: BAMBU_PRINTER_IP
            value: "YOUR_PRINTER_IP"
          - name: USERNAME
            value: "bblp"
          - name: PASSWORD
            value: "YOUR_PRINTER_PASSWORD"
          - name: MQTT_TOPIC
            value: "device/<SERIAL_NUMBER>/report"
        ports:
        - containerPort: 9101
        imagePullPolicy: Always
bambulabs-svc.yml
(I expose the printer through a MetalLB ingress IP below, you can change this to match your setup)
---
apiVersion: v1
kind: Service
metadata:
  name: bambuexporter-server-service
  namespace: exporters
  annotations:
    prometheus.io/scrape: 'true'
    prometheus.io/port:   '9101'
spec:
  selector:
    app: bambuexporter
  ports:
    - protocol: TCP
      port: 9101
      targetPort: 9101
  type: LoadBalancer
  loadBalancerIP: 192.168.X.X
Apply the manifest files to your cluster
kubectl apply -f bambulabs-namespace.yml -f bambulabs-deployment.yml -f bambulabs-svc.ymlYour cluster should pull down the pod and spin up the pod. Assuming you have the right networking to allow connectivity to your printer from your pods you should see the Prometheus exporter endpoint available.
Leave a Reply